Blog de Matemáticas de Patricia Sánchez


Recuperación Final 3ºESO
PARTE 1
1. Operar con fracciones y números decimales.
2. Conocer las propiedades de las potencias y aplicarlas para simplificar operaciones. Resolver problemas.
3. Transformar números decimales en fracciones y viceversa.
4. Operar con polinomios
5. Conocer las propiedades de las progresiones aritméticas y geométricas
PARTE 2
6. Resolver ecuaciones de primer y segundo grado. Resolver sistemas de ecuaciones lineales.
7. Plantear y resolver problemas con ecuaciones.
8. Conocer las relaciones métricas de las cónicas.
9. Aplicar los teoremas de Tales y Pitágoras para encontrar medidas que se desconocen en cálculos de volúmenes.
PARTE 3
10. Conocer las característitcas de una función.
11. Interpretar gráficas de funciones.
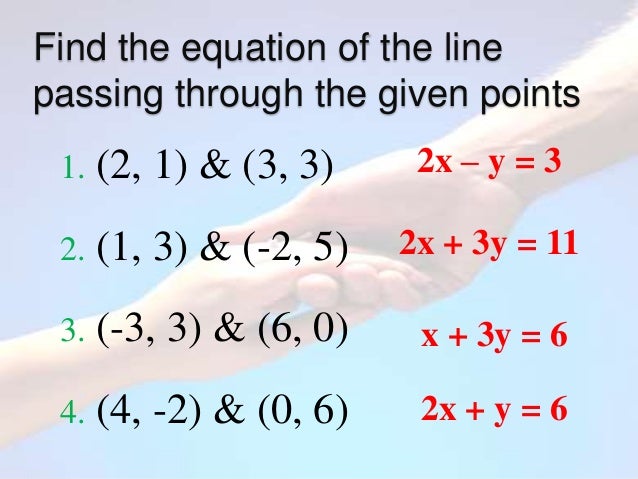
12. Calcular la ecuación de la recta y representarla.
13. Elaborar tablas y gráficos estadísticos.
14. Encontrar los parámetros de centralización y dispersión de una distribución estadística.
15. Calcular probabilidades aplicando la regla de Laplace.

Simple and Compound Probability
Probability
How likely something is to happen.
Many events can't be predicted with total certainty. The best we can say is how likely they are to happen, using the idea of probability. |
Tossing a CoinWhen a coin is tossed, there are two possible outcomes:
And the probability of the coin landing T is ½. |
 |
Throwing DiceWhen a single die is thrown, there are six possible outcomes: 1, 2, 3, 4, 5, 6.The probability of any one of them is 1/6. |
Probability
In general:
Probability of an event happening =
Number of ways it can happen
Total number of outcomes
Example: the chances of rolling a "4" with a die
Number of ways it can happen: 1 (there is only 1 face with a "4" on it)Total number of outcomes: 6 (there are 6 faces altogether)
So the probability =
1
6
Example: there are 5 marbles in a bag: 4 are blue, and 1 is red. What is the probability that a blue marble gets picked?
Number of ways it can happen: 4 (there are 4 blues)Total number of outcomes: 5 (there are 5 marbles in total)
So the probability =
4
5
= 0,8
Probability Line
We can show probability on a Probability Line:
Probability is always between 0 and 1
Probability is Just a Guide
Probability does not tell us exactly what will happen, it is just a guideExample: toss a coin 100 times, how many Heads will come up?
Probability says that heads have a ½ chance, so we can expect 50 Heads.But when we actually try it we might get 48 heads, or 55 heads ... or anything really, but in most cases it will be a number near 50.
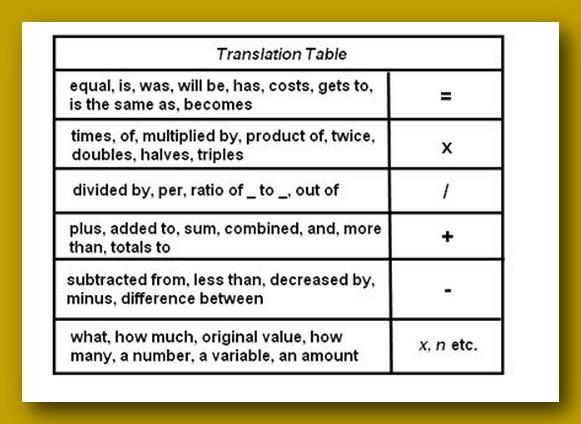
Words
Some words have special meaning in Probability:
Experiment or Trial: an action where the result is uncertain.
Tossing a coin, throwing dice, seeing what pizza people choose are all examples of experiments.
Sample Space: all the possible outcomes of an experiment
Example: choosing a card from a deck
There are 52 cards in a deck (not including Jokers)So the Sample Space is all 52 possible cards: {Ace of Hearts, 2 of Hearts, etc... }
Sample Point: just one of the possible outcomes
Example: Deck of Cards
- the 5 of Clubs is a sample point
- the King of Hearts is a sample point
Event: a single result of an experiment
Example Events:
- Getting a Tail when tossing a coin is an event
- Rolling a "5" is an event.
- Choosing a "King" from a deck of cards (any of the 4 Kings) is an event
- Rolling an "even number" (2, 4 or 6) is also an event
 |
The Sample Space is all possible outcomes. A Sample Point is just one possible outcome. And an Event can be one or more of the possible outcomes. |
Hey, let's use those words, so you get used to them:
Example: Alex wants to see how many times a "double" comes up when throwing 2 dice.
Each time Alex throws the 2 dice is an Experiment.It is an Experiment because the result is uncertain.
The Event Alex is looking for is a "double", where both dice have the same number. It is made up of these 6 Sample Points:
{1,1} {2,2} {3,3} {4,4} {5,5} and {6,6}
The Sample Space is all possible outcomes (36 Sample Points):
{1,1} {1,2} {1,3} {1,4} ... {6,3} {6,4} {6,5} {6,6}
These are Alex's Results:
| Experiment | Is it a Double? |
| {3,4} | No |
| {5,1} | No |
| {2,2} | Yes |
| {6,3} | No |
| ... | ... |
After 100 Experiments, Alex has 19 "double" Events ... is that close to what you would expect?
Activity: An Experiment with Dice
Let's throw two dice and add the scores ...You will need:
|
|
Interesting point
Many people think that one of these cubes is called "a dice". But no!The plural is dice, but the singular is die: i.e. 1 die, 2 dice.
We usually call the faces 1, 2, 3, 4, 5 and 6.
Throwing Two Dice and Adding the Scores ...
Example: when one die shows 2 and the other shows 6 the total score is 2 + 6 = 8
Question: Can you get a total of 8 any other way?
What about 6 + 2 = 8 (the other way around), is that a different way?
Yes! Because the two dice are different.
Yes! Because the two dice are different.
Example: imagine one die is colored red and the other is colored blue.
There are two possibilities:
 So 2 + 6 and 6 + 2 are different.
There are two possibilities:
And you can get 8 with other numbers, such as 3 + 5 = 8 and 4 + 4 = 8
High, Low, and Most Likely
Before we start, let's think about what might happen.Question: If you throw 2 dice together and add the two scores:
- 1. What is the least possible total score?
- 2. What is the greatest possible total score?
- 3. What do you think is the most likely total score?
The first two questions are quite easy to answer:
To help answer the third question let us try an experiment. - 1. The least possible total score must be 1 + 1 = 2
- 2. The greatest possible total score must be 6 + 6 = 12
- 3. The most likely total score is ... ???
The Experiment
Throw two dice together 108 times,
add the scores together each time,
record the scores in a tally table.
add the scores together each time,
record the scores in a tally table.
You can record the results in this table using tally marks:
| Added Scores |
Tally | Frequency |
| 2 | ||
| 3 | ||
| 4 | ||
| 5 | ||
| 6 | ||
| 7 | ||
| 8 | ||
| 9 | ||
| 10 | ||
| 11 | ||
| 12 | ||
| Total Frequency = | 108 |
OK, Go!
...
...
| Finished ...? Now draw a bar graph to show your results. Or you can use Data Graphs (Bar, Line and Pie) then print it out. |
||
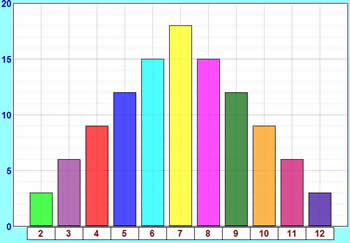
You may get something like this: |
 |
- Are the bars all about the same height?
- If not ... why not?
So Why Did We Get That Shape?
The explanation is simple:- There is only one way to get a total of 2 (1 + 1),
- but there are six ways of getting a total of 7 (1 + 6, 2 + 5, 3 + 4, 4 + 3, 5 + 2 and 6 + 1)
| Score on One Die | |||||||
| 1 | 2 | 3 | 4 | 5 | 6 | ||
| Score on the Other Die |
1 | 2 | 3 | 4 | 5 | 6 | 7 |
| 2 | 3 | 4 | 5 | 6 | 7 | 8 | |
| 3 | 4 | 5 | 6 | 7 | 8 | 9 | |
| 4 | 5 | 6 | 7 | 8 | 9 | 10 | |
| 5 | 6 | 7 | 8 | 9 | 10 | 11 | |
| 6 | 7 | 8 | 9 | 10 | 11 | 12 | |
You can see there is only 1 way to get 2, there are 2 ways to get 3, and so on.
Let us count the ways of getting each total and put them in a table:| Total Score |
Number of Ways to Get Score |
| 2 | 1 |
| 3 | 2 |
| 4 | 3 |
| 5 | 4 |
| 6 | 5 |
| 7 | 6 |
| 8 | 5 |
| 9 | 4 |
| 10 | 3 |
| 11 | 2 |
| 12 | 1 |
| Total = 36 |
- 2 and 12 have the same number of ways = 1 each
- 3 and 11 have the same number of ways = 2 each
- 4 and 10 have the same number of ways = 3 each
- 5 and 9 have the same number of ways = 4 each
- 6 and 8 have the same number of ways = 5 each
108 Throws
OK, why 108 throws? Well, only 36 throws might not give good results, 360 throws would be great, but take a long time, so 108 (which is 3 lots of 36) seems just right.So let's multiply all these numbers by 3 to match our total of 108:
| Total Score |
Number of Ways to Get Score |
| 2 | 3 |
| 3 | 6 |
| 4 | 9 |
| 5 | 12 |
| 6 | 15 |
| 7 | 18 |
| 8 | 15 |
| 9 | 12 |
| 10 | 9 |
| 11 | 6 |
| 12 | 3 |
| Total = 108 |
The theoretical values look like this in a bar graph:
How do these theoretical results compare with your experimental results?
If you did the experiment a very large number of times, you should get results much closer to the theoretical ones.
And, by the way, we've now answered the question from near the beginning of the experiment:
What is the most likely total score?
- 7 has the highest bar, so 7 is the most likely total score.
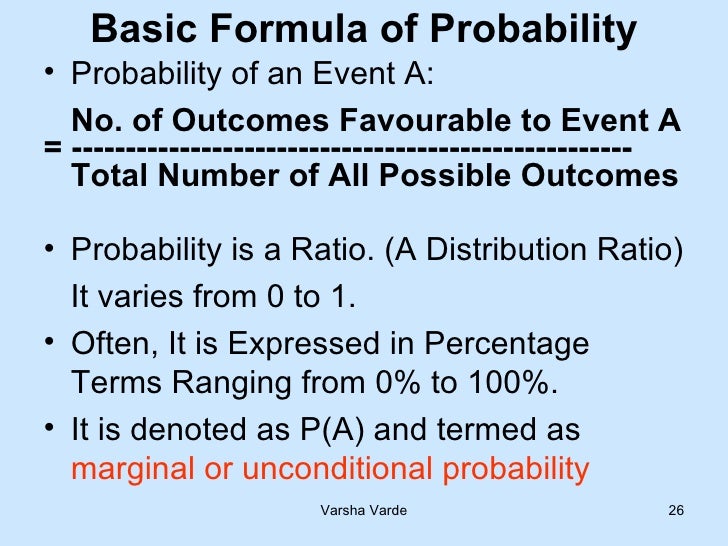
Probability
On the page Probability you will find a formula:
Probability of an event happening =
Number of ways it can happen
Total number of outcomes
Example: Probability of a total of 2
We know there are 36 possible outcomes.And there is only 1 way to get a total score of 2.
So the probability of getting 2 is:
Probability of a 2 =
1
36
| Total Score |
Probability |
| 2 | 1/36 |
| 3 | 2/36 |
| 4 | 3/36 |
| 5 | 4/36 |
| 6 | 5/36 |
| 7 | 6/36 |
| 8 | 5/36 |
| 9 | 4/36 |
| 10 | 3/36 |
| 11 | 2/36 |
| 12 | 1/36 |
| Total = 1 |
(Note: I didn't simplify the fractions)


Introduction to statistics

Pie Chart
Pie Chart: a special chart that uses "pie slices" to show relative sizes of data.
Imagine you survey your friends to find the kind of movie they like best: | Table: Favorite Type of Movie | ||||
| Comedy | Action | Romance | Drama | SciFi |
|---|---|---|---|---|
| 4 | 5 | 6 | 1 | 4 |
How to Make Them Yourself
First, put your data into a table (like above), then add up all the values to get a total:| Table: Favorite Type of Movie | |||||
| Comedy | Action | Romance | Drama | SciFi | TOTAL |
|---|---|---|---|---|---|
| 4 | 5 | 6 | 1 | 4 | 20 |
| Comedy | Action | Romance | Drama | SciFi | TOTAL |
|---|---|---|---|---|---|
| 4 | 5 | 6 | 1 | 4 | 20 |
| 4/20 = 20% |
5/20 = 25% |
6/20 = 30% |
1/20 = 5% |
4/20 = 20% |
100% |
Now to figure out how many degrees for each "pie slice" (correctly called a sector).
A Full Circle has 360 degrees, so we do this calculation:
| Comedy | Action | Romance | Drama | SciFi | TOTAL |
|---|---|---|---|---|---|
| 4 | 5 | 6 | 1 | 4 | 20 |
| 20% | 25% | 30% | 5% | 20% | 100% |
| 4/20 × 360° = 72° |
5/20 × 360° = 90° |
6/20 × 360° = 108° |
1/20 × 360° = 18° |
4/20 × 360° = 72° |
360° |
Draw a circle.
Then use your protractor to measure the degrees of each sector.
Here I show the first sector ...
Finish up by coloring each sector and giving it a label like "Comedy: 4 (20%)", etc.
(And don't forget a title!)
You can use pie charts to show the relative sizes of many things, such as:
- what type of car people have,
- how many customers a shop has on different days and so on.
- how popular are different breeds of dogs
Your turn: Student Grades
Here is how many students got each grade in the recent test:| A | B | C | D |
| 4 | 12 | 10 | 2 |


Introduction to Linear Functions - grade 3

http://www.mathmammoth.com/preview/Cell_Phone_Plan_Linear_Equations.pdf

El peligro de las redes sociales
Los riesgos de Internet y de las redes sociales para los niños
¿Cuáles son los consejos fundamentales que deben seguir los niños en las redes sociales?
Algunas de las pautas a seguir por el código son:
- Cuando me haga un perfil social, configuraré adecuadamemnte la privacidad para que el contenido que publique sólo pueda ser visto por mis amigos.
- Tendré en cuenta que las personas que conozco por internet son desconocidos en la vida real, NO SON MIS AMIGOS.
- No publicaré información personal como mi teléfono, dirección etc, en Internet
- Cuando se publica una foto en Internet, se pierde el control sobre su difusión y duración. Aunque después se borre, no desaparece de la Red.
- En Internet hay que comportarse con respeto y educación. No hagas a otros lo que no quieras que te hagan a tí.
- Denuncia a las personas o las acciones que perjudiquen a los demás. Si concoes alguien que esté siento acosado, DENÚNCIALO.
- Si adquieres un teléfono movil con internet, desconecta la opción de geolocalización, asi cuando publiques en tu muro desde el movil, nadie sabrá dónde estás.
- Guardaré las conversaciones del chat, ya que te puede ser útil en caso que haya algún problema.
- Si me ocurre algo que no me haga sentir bien en Internet, se lo cumunicaré a mis padres. Tengo que saber decir NO a las cosas que no quiera hacer y contar con mis padres que son mis mejores aliados.
- El mejor filtro para Internet es el conocimiento.
¿Cuáles son los riesgos para los niños en Internet y en las redes sociales?
De esas nuevas formas de comunicarse han surgido nuevos riesgos o formas de acoso con un impacto fatal como el grooming, una práctica a través de la cual un adulto se gana la confianza de un menor con un propósito sexual. El sexting o intercambio de fotografías o vídeos con contenido erótico entre los propios jóvenes con las que luego llegan a extorsionarse causando daños psicológicos importantes. Por otra parte, existe el conocido como ciberbullying, o acoso entre menores que en Internet por su carácter global, supone un alcance que puede llegar a generar mucho daños no sólo al menos sino a su familia y amigos.
De esas nuevas formas de comunicarse han surgido nuevos riesgos o formas de acoso con un impacto fatal como el grooming, una práctica a través de la cual un adulto se gana la confianza de un menor con un propósito sexual. El sexting o intercambio de fotografías o vídeos con contenido erótico entre los propios jóvenes con las que luego llegan a extorsionarse causando daños psicológicos importantes. Por otra parte, existe el conocido como ciberbullying, o acoso entre menores que en Internet por su carácter global, supone un alcance que puede llegar a generar mucho daños no sólo al menos sino a su familia y amigos.
¿A partir de qué edad entran los niños en las redes sociales?
En España, la edad mínima para acceder a una red social, excepto a las específicas para menores, es de 14 años. Actualmente, Tuenti está trabajando con los menores 14 que quieren acceder a la red social a través del consentimiento paterno. Por ello, la Red Social solicita el permiso paterno antes de permitir que se lleve a cabo el registro del perfil.
En España, la edad mínima para acceder a una red social, excepto a las específicas para menores, es de 14 años. Actualmente, Tuenti está trabajando con los menores 14 que quieren acceder a la red social a través del consentimiento paterno. Por ello, la Red Social solicita el permiso paterno antes de permitir que se lleve a cabo el registro del perfil.
¿A qué edad los niños disponen ya de su propio teléfono móvil?
El desarrollo de la telefonía móvil y de los conocidos como Smartphones permite que los jóvenes puedan tener acceso a Internet en su bolsillo. Según el Estudio sobre seguridad y privacidad en el uso de los servicios móviles por los menores españoles, elaborado en 2010 por INTECO y Orange, la edad media de inicio en la telefonía móvil por parte de los menores españoles se sitúa entre los 10 y los 12 años. Además, la mayoría de los menores accede a internet en su casa o en la calle.
El desarrollo de la telefonía móvil y de los conocidos como Smartphones permite que los jóvenes puedan tener acceso a Internet en su bolsillo. Según el Estudio sobre seguridad y privacidad en el uso de los servicios móviles por los menores españoles, elaborado en 2010 por INTECO y Orange, la edad media de inicio en la telefonía móvil por parte de los menores españoles se sitúa entre los 10 y los 12 años. Además, la mayoría de los menores accede a internet en su casa o en la calle.
¿Cómo advertirles de los peligros de esta nueva forma de comunicación?Los
pequeños tienen que valorar la comunicación física por encima de la que
pueden entablar a través de las nuevas tecnologías. Las ventajas de
conocer al interlocutor frente a los riesgos de no hacerlo. Su educación es la base de un futuro Internet más seguro. Así, es importante decirles que tienen que tener en cuenta que hablar habitualmente con un desconocido en internet, no le convierte en conocido. La
adicción a las nuevas tecnologías es un problema en alza que los padres
no deben descuidar y darle la importancia que tiene. El tiempo que
pasen sus hijos en Internet tiene que estar limitado, según sean las
motivaciones de uso de la red y la edad.

Introduction to functions - 3ºeso
1. Fill in the gaps.
horizontal left
negative negative negative
negative negative negative
numbers origin positive
positive positive positive
right variables vertical
x y zero
zero
When
working with equations that have two (1)__________, the coordinate plane is an
important tool. It's a way to draw pictures of equations that makes them easier
to understand.
To
create a coordinate plane, start with a sheet of graph paper. Next, draw a
(2)__________ line. This line is called the x-axis and is used to locate values
of x. To show that the axis actually goes on forever in both directions, use
small arrowheads at each end of the line. Mark off a number line with
(3)__________ in the center, positive numbers to the (4)__________, and
negative numbers to the (5)__________.
Next
draw a (6)__________ line that intersects the x axis at zero. This line is
called the y-axis and is used to locate the values of y. Mark off a number line
with zero in the center, (7)__________ numbers going upwards, and (8)__________
numbers going downwards. The point where the x and y axes intersect is called
the origin. The origin is located at (9)__________ on the x axis and zero on
the y axis.
Locating
Points Using Ordered Pairs
We
can locate any point on the coordinate plane using an ordered pair of numbers.
We call the ordered pair the coordinates of the point. The coordinates of a
point are called an ordered pair because the order of the two (10)__________ is
important.
The
first number in the ordered pair is the (11)__________ coordinate. It describes
the number of units to the left or right of the origin. The second number in
the ordered pair is the (12)__________ coordinate. It describes the number of
units above or below the origin. To plot a point, start at the (13)__________
and count along the x axis until you reach the x coordinate, count right for
positive numbers, left for negative. Then count up or down the number of the y
coordinate (up for (14)__________, down for (15)__________.)
Quadrants
To
make it easy to talk about where on the coordinate plane a point is, we divide
the coordinate plane into four sections called quadrants.
Points
in Quadrant 1 have positive x and positive y coordinates.
Points
in Quadrant 2 have (16)__________ x but (17)__________ y coordinates.
Points
in Quadrant 3 have (18)__________ x and (19)__________ y coordinates.
Points
in Quadrant 4 have (20)__________ x but (21)__________ y coordinates.
2. Match each word with its translation in
Spanish.
COORDINATE PLANE EJES
CARTESIANOS
DEPENDENT VARIABLE VARIABLE
DEPENDIENTE
INDEPENDENT VARIABLE FUNCIÓN
FUNCTION PAR
ORDENADO
SET
OF POINTS VARIABLE
INDEPENDIENTE
3. Complete the Crossword.
|
|
||||||||||||||

Reading Comprehension
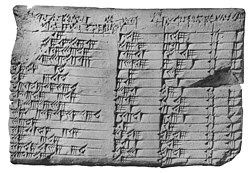
Tallies and Tablets - The Origins of Mathematics
By Colleen Messina |
 1 Have you
ever wondered what a teraflop is? No, it is not a clumsy, prehistoric fish. A
teraflop is a unit that measures the speed of computer calculations. One
teraflop is 1 trillion calculations per second, and today there are computers
that can sustain speeds of 35.86 teraflops! These incredible electronic
calculations originated with the idea of numbers and counting. Most of us take
math for granted, but numbers and counting have taken thousands of years to
develop. So how did it all begin?
1 Have you
ever wondered what a teraflop is? No, it is not a clumsy, prehistoric fish. A
teraflop is a unit that measures the speed of computer calculations. One
teraflop is 1 trillion calculations per second, and today there are computers
that can sustain speeds of 35.86 teraflops! These incredible electronic
calculations originated with the idea of numbers and counting. Most of us take
math for granted, but numbers and counting have taken thousands of years to
develop. So how did it all begin?2 Tens of thousands of years ago, our ancestors found their food by hunting for meat and gathering wild plants. Survival was a constant struggle. Little did they realize that some mathematics could vastly improve their lives. For example, if they knew when certain berries were ripe, they could save themselves a lot of wandering time by only going to the berry thickets at precisely the right moment. The hunters and gatherers of ancient times needed something constant in their environment to help them track time.
3 The most constant thing in their world was the sky since the landscape changed through the seasons of the year. Early peoples observed the geometry in nature, the cycles of the seasons, and the splendor of the Milky Way. Our ancestors noticed the moon's pattern of becoming full, then slender, then full again in a recurring thirty-day cycle. This cycle gave them a key to solving the dilemma of tracking time. With this knowledge, they observed that sour, green berries took approximately a full cycle of the moon to ripen, so they began to cut notches in a tree or a stick to keep track of the days of the lunar cycle. Harvesting the berries and other food became much more efficient with this new system.
4 The idea of keeping track of the lunar cycle sounds simple, but it was a momentous event in the evolution of mathematics. Our ancestors were keeping a tally, for the first time, and they probably began to use this form of counting in other areas of their lives. The earliest known tallies were carvings in bones dated approximately 15,000 years ago, which were discovered in the area now known as the Middle East. Putting pebbles or shells in a pile was another way of keeping a tally. Keeping track of items by using simple marks or objects was still a long way off from the invention of numerals, but it was a big step forward.
5 Another way that early people kept track of things was by using "body counting." Different parts of the body represented different amounts of things. For many thousands of years people counted using their ten fingers, and some tribes took this idea even further. The Paiela tribe, who lived in the highlands of Papua New Guinea, counted by pointing to different parts of their bodies to represent different numbers. For example, their little fingers represented the number "one." Other fingers, wrists, elbows, shoulders, ears and eyes all represented different numbers up to twenty. Body counting worked fine as long as there was no need for large numbers.
6 When our ancestors became farmers, they needed to keep track of larger amounts of things. Farming probably started when the hunters and gatherers visited a campsite where they had lived during the previous season and noticed grain growing from seeds they had accidentally dropped on the ground. They learned to save seeds and sow crops rather than gather wild plants. They also learned to keep sheep, goats, and cows in pens and slaughter them rather than hunt for wild animals. Life became easier, and villages formed since no one had to wander around to survive. A better system of counting evolved because the men who became shepherds had to count their animals, and the men who became farmers had to keep track of their harvest.
2. Answer the following questions.
|
|
||||
|
|
||||
|
|
||||
|
|
3.
Read the following text about the Age of Discovery.
The Age of Discovery - Gravity and Gauss
By Colleen Messina |
 1 By the
seventeenth century, mathematics had come a long way from the tallies and abacuses
of the ancient world. Mathematicians had finally adopted the new Arabic
numbers, as well as the symbols for addition, subtraction, multiplication, and
division. Logarithms made difficult problems much easier, and calculus opened
up new possibilities in science. Mathematicians applied these new tools in
exciting ways ranging from world exploration to astronomy. Ships crisscrossed
the oceans to new places, and telescopes scanned the skies and discovered the
elliptical orbits of planets. The understanding of gravity revolutionized
military science. It was truly an age of discovery.
1 By the
seventeenth century, mathematics had come a long way from the tallies and abacuses
of the ancient world. Mathematicians had finally adopted the new Arabic
numbers, as well as the symbols for addition, subtraction, multiplication, and
division. Logarithms made difficult problems much easier, and calculus opened
up new possibilities in science. Mathematicians applied these new tools in
exciting ways ranging from world exploration to astronomy. Ships crisscrossed
the oceans to new places, and telescopes scanned the skies and discovered the
elliptical orbits of planets. The understanding of gravity revolutionized
military science. It was truly an age of discovery.2 The discovery of gravity especially changed how people viewed the world. Up until the 16th century, people thought that heavy objects fell faster. A feisty Italian named Galileo Galilei had another idea. In 1585, he climbed to the top of the leaning Tower of Pisa, made sure no one was down below, and dropped two objects. One object was heavy and the other was light, but both reached the ground at the same time. Galileo proved that objects fall at the same rate and accelerate as they fall. Eventually, military engineers understood that a cannonball shoots out in a straight path, but the force of gravity makes the cannonball fall downward in a curve called a parabola. The engineers could then fortify their strongholds in the right places, and artillerymen could shoot their cannons more accurately. Galileo's experiment revolutionized military science.
3 Galileo also did experiments with pendulums that helped clockmakers design accurate clocks. Seamen needed accurate time-keeping devices to navigate during long journeys. The weight-driven clocks of the previous centuries were not accurate enough; now seamen needed to measure minutes and seconds, so the new clocks were invaluable. Navigators then accurately plotted the daily positions of their ships on maps that had vertical and horizontal lines of latitude and longitude. When they connected the dots on these grids, they saw an accurate record of the ship's journey.
4 Rene Descartes, a great French mathematician and philosopher, also liked grids. He had a big nose and a sheath of black hair that came down to his eyebrows. He always stayed in bed until late in the morning and said that that was the only way to get ready to do mathematics! Descartes tied geometry and algebra together by writing equations for a geometric shape, like a parabola, on a graph. His analytic geometry became the foundation of the higher mathematics of today, and some people call him the first modern mathematician. The Cartesian coordinate system is named after Descartes.
5 Another mathematician who laid the foundation for higher math was a number-crunching prodigy. In 1779, three-year-old Carl Friedrich Gauss watched his father add up the payroll for a crew of bricklayers and pointed out a mistake his father made in the calculations! When Gauss was 14, a wealthy Duke noticed his incredible abilities and was so impressed that he sponsored Gauss's entire education. This patronage was well deserved, as Gauss dominated mathematics of the nineteenth century.
6 Gauss first became famous when an Italian astronomer discovered an asteroid in 1801. Joseph Piazzi accidentally found a minor planet and then lost sight of it in the bright sky near the sun. This new planet, called Ceres, caused a great rush of excitement all over Europe. When it disappeared, astronomers were upset because they didn't know how to find the new planet again. Gauss used the tables of logarithms he had memorized to predict where Ceres would reappear. The tiny planet showed up on the other side of the sun just where Gauss said it would! Gauss received many honors from scientific societies because of this triumph.
4. Answer the following questions.
|
|
||||
|
|
||||
|
|
||||
|
|
Subscribe to:
Posts (Atom)