PARTE 1 1. Operar con fracciones y números decimales. 2. Conocer las propiedades de las potencias y aplicarlas para simplificar operaciones. Resolver problemas. 3. Transformar números decimales en fracciones y viceversa. 4. Operar con polinomios 5. Conocer las propiedades de las progresiones aritméticas y geométricas
PARTE 2 6. Resolver ecuaciones de primer y segundo grado. Resolver sistemas de ecuaciones lineales. 7. Plantear y resolver problemas con ecuaciones. 8. Conocer las relaciones métricas de las cónicas. 9. Aplicar los teoremas de Tales y Pitágoras para encontrar medidas que se desconocen en cálculos de volúmenes. PARTE 3 10. Conocer las característitcas de una función. 11. Interpretar gráficas de funciones. 12. Calcular la ecuación de la recta y representarla. 13. Elaborar tablas y gráficos estadísticos. 14. Encontrar los parámetros de centralización y dispersión de una distribución estadística. 15. Calcular probabilidades aplicando la regla de Laplace.
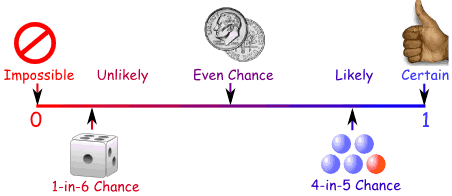
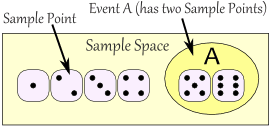
Probability does not tell us exactly what will happen, it is just a guide
Example: toss a coin 100 times, how many Heads will come up?
Probability says that heads have a ½ chance, so we can expect 50 Heads.
But when we actually try it we might get 48 heads, or 55
heads ... or anything really, but in most cases it will be a number near
50.
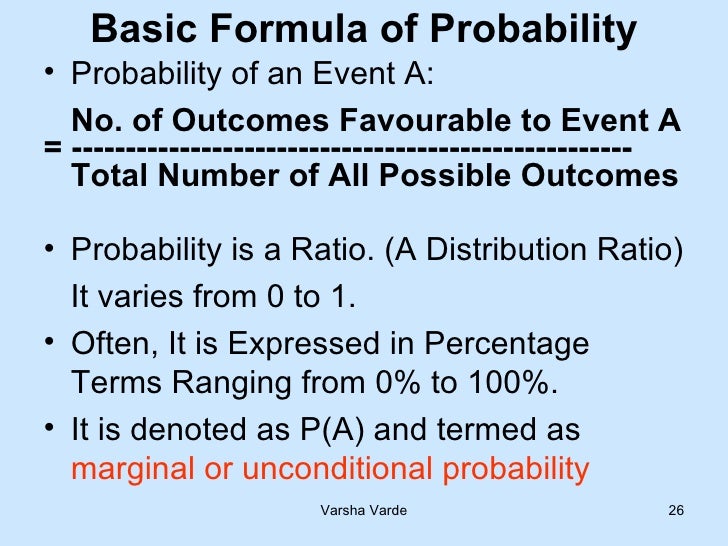
OK, why 108 throws? Well, only 36 throws might not give good
results, 360 throws would be great, but take a long time, so 108
(which is 3 lots of 36) seems just right.
So let's multiply all these numbers by 3 to match our total of 108:
Total
Score
Number of
Ways to Get
Score
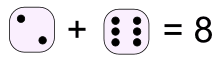
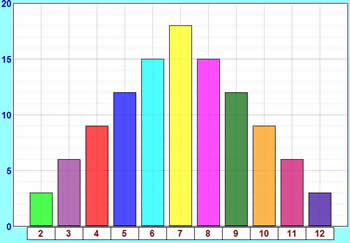
2
3
3
6
4
9
5
12
6
15
7
18
8
15
9
12
10
9
11
6
12
3
Total = 108
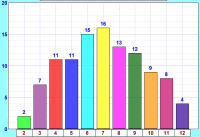
Those are the theoretical values, as opposed to the experimental ones you got from your experiment.
The theoretical values look like this in a bar graph:
How do these theoretical results compare with your experimental results?
This graph and your graph should be quite similar, but they are not likely to be exactly the same, as your experiment relied on chance, and the number of times you did it was fairly small.
If you did the experiment a very large number of times, you should get results much closer to the theoretical ones.
And, by the way, we've now answered the question from near the beginning of the experiment:
What is the most likely total score?
7 has the highest bar, so 7 is the most likely total score.