Blog de Matemáticas de Patricia Sánchez


Recuperación Final 3ºESO

PARTE 1
1. Operar con fracciones y números decimales.
2. Conocer las propiedades de las potencias y aplicarlas para simplificar operaciones. Resolver problemas.
3. Transformar números decimales en fracciones y viceversa.
4. Operar con polinomios
5. Conocer las propiedades de las progresiones aritméticas y geométricas
PARTE 2
6. Resolver ecuaciones de primer y segundo grado. Resolver sistemas de ecuaciones lineales.
7. Plantear y resolver problemas con ecuaciones.
8. Conocer las relaciones métricas de las cónicas.
9. Aplicar los teoremas de Tales y Pitágoras para encontrar medidas que se desconocen en cálculos de volúmenes.
PARTE 3
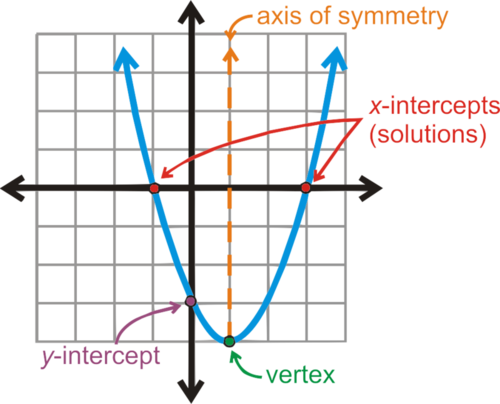
10. Conocer las característitcas de una función.
11. Interpretar gráficas de funciones.
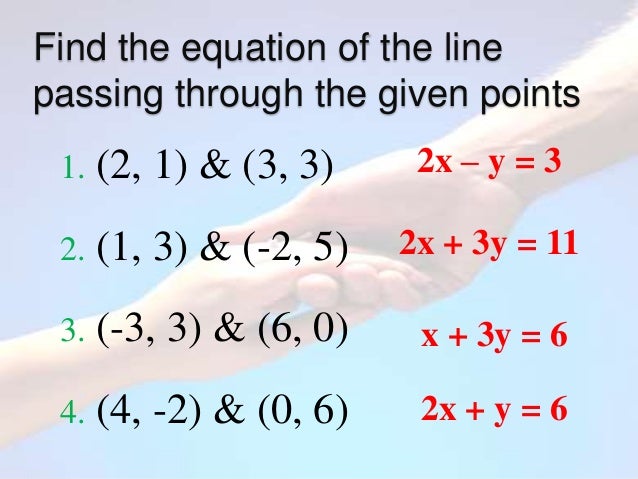
12. Calcular la ecuación de la recta y representarla.
13. Elaborar tablas y gráficos estadísticos.
14. Encontrar los parámetros de centralización y dispersión de una distribución estadística.
15. Calcular probabilidades aplicando la regla de Laplace.

Simple and Compound Probability
Probability
How likely something is to happen.
Many events can't be predicted with total certainty. The best we can say is how likely they are to happen, using the idea of probability. |
Tossing a CoinWhen a coin is tossed, there are two possible outcomes:
And the probability of the coin landing T is ½. |
 |
Throwing DiceWhen a single die is thrown, there are six possible outcomes: 1, 2, 3, 4, 5, 6.The probability of any one of them is 1/6. |
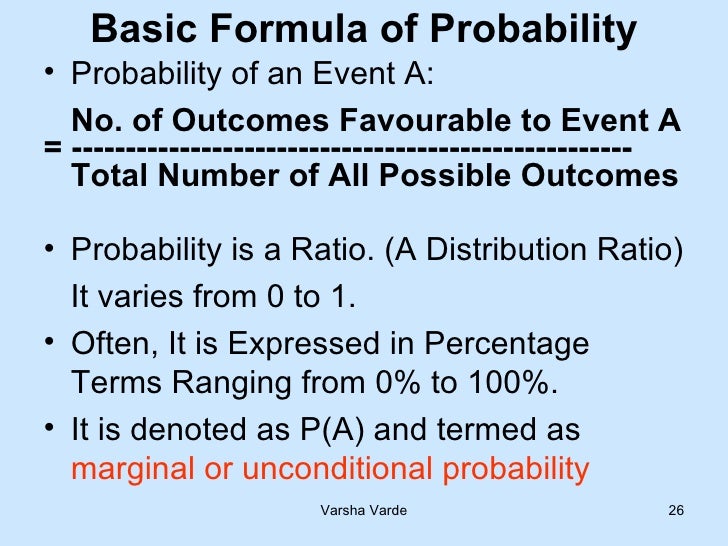
Probability
In general:
Probability of an event happening =
Number of ways it can happen
Total number of outcomes
Example: the chances of rolling a "4" with a die
Number of ways it can happen: 1 (there is only 1 face with a "4" on it)Total number of outcomes: 6 (there are 6 faces altogether)
So the probability =
1
6
Example: there are 5 marbles in a bag: 4 are blue, and 1 is red. What is the probability that a blue marble gets picked?
Number of ways it can happen: 4 (there are 4 blues)Total number of outcomes: 5 (there are 5 marbles in total)
So the probability =
4
5
= 0,8
Probability Line
We can show probability on a Probability Line:
Probability is always between 0 and 1
Probability is Just a Guide
Probability does not tell us exactly what will happen, it is just a guideExample: toss a coin 100 times, how many Heads will come up?
Probability says that heads have a ½ chance, so we can expect 50 Heads.But when we actually try it we might get 48 heads, or 55 heads ... or anything really, but in most cases it will be a number near 50.
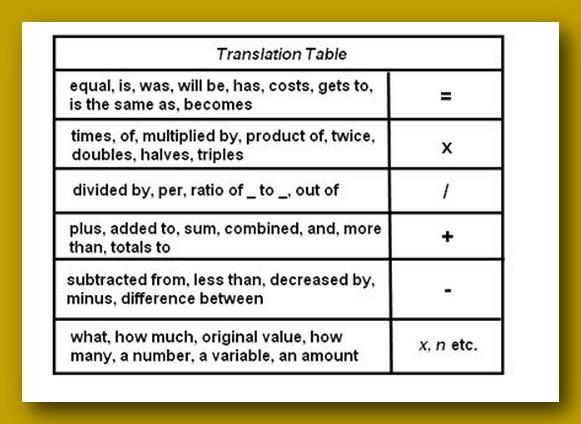
Words
Some words have special meaning in Probability:
Experiment or Trial: an action where the result is uncertain.
Tossing a coin, throwing dice, seeing what pizza people choose are all examples of experiments.
Sample Space: all the possible outcomes of an experiment
Example: choosing a card from a deck
There are 52 cards in a deck (not including Jokers)So the Sample Space is all 52 possible cards: {Ace of Hearts, 2 of Hearts, etc... }
Sample Point: just one of the possible outcomes
Example: Deck of Cards
- the 5 of Clubs is a sample point
- the King of Hearts is a sample point
Event: a single result of an experiment
Example Events:
- Getting a Tail when tossing a coin is an event
- Rolling a "5" is an event.
- Choosing a "King" from a deck of cards (any of the 4 Kings) is an event
- Rolling an "even number" (2, 4 or 6) is also an event
 |
The Sample Space is all possible outcomes. A Sample Point is just one possible outcome. And an Event can be one or more of the possible outcomes. |
Hey, let's use those words, so you get used to them:
Example: Alex wants to see how many times a "double" comes up when throwing 2 dice.
Each time Alex throws the 2 dice is an Experiment.It is an Experiment because the result is uncertain.
The Event Alex is looking for is a "double", where both dice have the same number. It is made up of these 6 Sample Points:
{1,1} {2,2} {3,3} {4,4} {5,5} and {6,6}
The Sample Space is all possible outcomes (36 Sample Points):
{1,1} {1,2} {1,3} {1,4} ... {6,3} {6,4} {6,5} {6,6}
These are Alex's Results:
| Experiment | Is it a Double? |
| {3,4} | No |
| {5,1} | No |
| {2,2} | Yes |
| {6,3} | No |
| ... | ... |
After 100 Experiments, Alex has 19 "double" Events ... is that close to what you would expect?
Activity: An Experiment with Dice
Let's throw two dice and add the scores ...You will need:
|
|
Interesting point
Many people think that one of these cubes is called "a dice". But no!The plural is dice, but the singular is die: i.e. 1 die, 2 dice.
We usually call the faces 1, 2, 3, 4, 5 and 6.
Throwing Two Dice and Adding the Scores ...
Example: when one die shows 2 and the other shows 6 the total score is 2 + 6 = 8
Question: Can you get a total of 8 any other way?
What about 6 + 2 = 8 (the other way around), is that a different way?
Yes! Because the two dice are different.
Yes! Because the two dice are different.
Example: imagine one die is colored red and the other is colored blue.
There are two possibilities:
 So 2 + 6 and 6 + 2 are different.
There are two possibilities:
And you can get 8 with other numbers, such as 3 + 5 = 8 and 4 + 4 = 8
High, Low, and Most Likely
Before we start, let's think about what might happen.Question: If you throw 2 dice together and add the two scores:
- 1. What is the least possible total score?
- 2. What is the greatest possible total score?
- 3. What do you think is the most likely total score?
The first two questions are quite easy to answer:
To help answer the third question let us try an experiment. - 1. The least possible total score must be 1 + 1 = 2
- 2. The greatest possible total score must be 6 + 6 = 12
- 3. The most likely total score is ... ???
The Experiment
Throw two dice together 108 times,
add the scores together each time,
record the scores in a tally table.
add the scores together each time,
record the scores in a tally table.
You can record the results in this table using tally marks:
| Added Scores |
Tally | Frequency |
| 2 | ||
| 3 | ||
| 4 | ||
| 5 | ||
| 6 | ||
| 7 | ||
| 8 | ||
| 9 | ||
| 10 | ||
| 11 | ||
| 12 | ||
| Total Frequency = | 108 |
OK, Go!
...
...
| Finished ...? Now draw a bar graph to show your results. Or you can use Data Graphs (Bar, Line and Pie) then print it out. |
||
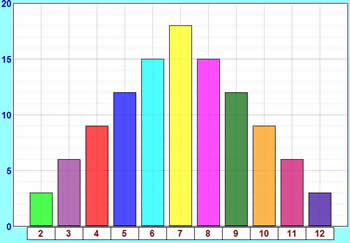
You may get something like this: |
 |
- Are the bars all about the same height?
- If not ... why not?
So Why Did We Get That Shape?
The explanation is simple:- There is only one way to get a total of 2 (1 + 1),
- but there are six ways of getting a total of 7 (1 + 6, 2 + 5, 3 + 4, 4 + 3, 5 + 2 and 6 + 1)
| Score on One Die | |||||||
| 1 | 2 | 3 | 4 | 5 | 6 | ||
| Score on the Other Die |
1 | 2 | 3 | 4 | 5 | 6 | 7 |
| 2 | 3 | 4 | 5 | 6 | 7 | 8 | |
| 3 | 4 | 5 | 6 | 7 | 8 | 9 | |
| 4 | 5 | 6 | 7 | 8 | 9 | 10 | |
| 5 | 6 | 7 | 8 | 9 | 10 | 11 | |
| 6 | 7 | 8 | 9 | 10 | 11 | 12 | |
You can see there is only 1 way to get 2, there are 2 ways to get 3, and so on.
Let us count the ways of getting each total and put them in a table:| Total Score |
Number of Ways to Get Score |
| 2 | 1 |
| 3 | 2 |
| 4 | 3 |
| 5 | 4 |
| 6 | 5 |
| 7 | 6 |
| 8 | 5 |
| 9 | 4 |
| 10 | 3 |
| 11 | 2 |
| 12 | 1 |
| Total = 36 |
- 2 and 12 have the same number of ways = 1 each
- 3 and 11 have the same number of ways = 2 each
- 4 and 10 have the same number of ways = 3 each
- 5 and 9 have the same number of ways = 4 each
- 6 and 8 have the same number of ways = 5 each
108 Throws
OK, why 108 throws? Well, only 36 throws might not give good results, 360 throws would be great, but take a long time, so 108 (which is 3 lots of 36) seems just right.So let's multiply all these numbers by 3 to match our total of 108:
| Total Score |
Number of Ways to Get Score |
| 2 | 3 |
| 3 | 6 |
| 4 | 9 |
| 5 | 12 |
| 6 | 15 |
| 7 | 18 |
| 8 | 15 |
| 9 | 12 |
| 10 | 9 |
| 11 | 6 |
| 12 | 3 |
| Total = 108 |
The theoretical values look like this in a bar graph:
How do these theoretical results compare with your experimental results?
If you did the experiment a very large number of times, you should get results much closer to the theoretical ones.
And, by the way, we've now answered the question from near the beginning of the experiment:
What is the most likely total score?
- 7 has the highest bar, so 7 is the most likely total score.
Probability
On the page Probability you will find a formula:
Probability of an event happening =
Number of ways it can happen
Total number of outcomes
Example: Probability of a total of 2
We know there are 36 possible outcomes.And there is only 1 way to get a total score of 2.
So the probability of getting 2 is:
Probability of a 2 =
1
36
| Total Score |
Probability |
| 2 | 1/36 |
| 3 | 2/36 |
| 4 | 3/36 |
| 5 | 4/36 |
| 6 | 5/36 |
| 7 | 6/36 |
| 8 | 5/36 |
| 9 | 4/36 |
| 10 | 3/36 |
| 11 | 2/36 |
| 12 | 1/36 |
| Total = 1 |
(Note: I didn't simplify the fractions)


Introduction to statistics

Pie Chart
Pie Chart: a special chart that uses "pie slices" to show relative sizes of data.
Imagine you survey your friends to find the kind of movie they like best: | Table: Favorite Type of Movie | ||||
| Comedy | Action | Romance | Drama | SciFi |
|---|---|---|---|---|
| 4 | 5 | 6 | 1 | 4 |
How to Make Them Yourself
First, put your data into a table (like above), then add up all the values to get a total:| Table: Favorite Type of Movie | |||||
| Comedy | Action | Romance | Drama | SciFi | TOTAL |
|---|---|---|---|---|---|
| 4 | 5 | 6 | 1 | 4 | 20 |
| Comedy | Action | Romance | Drama | SciFi | TOTAL |
|---|---|---|---|---|---|
| 4 | 5 | 6 | 1 | 4 | 20 |
| 4/20 = 20% |
5/20 = 25% |
6/20 = 30% |
1/20 = 5% |
4/20 = 20% |
100% |
Now to figure out how many degrees for each "pie slice" (correctly called a sector).
A Full Circle has 360 degrees, so we do this calculation:
| Comedy | Action | Romance | Drama | SciFi | TOTAL |
|---|---|---|---|---|---|
| 4 | 5 | 6 | 1 | 4 | 20 |
| 20% | 25% | 30% | 5% | 20% | 100% |
| 4/20 × 360° = 72° |
5/20 × 360° = 90° |
6/20 × 360° = 108° |
1/20 × 360° = 18° |
4/20 × 360° = 72° |
360° |
Draw a circle.
Then use your protractor to measure the degrees of each sector.
Here I show the first sector ...
Finish up by coloring each sector and giving it a label like "Comedy: 4 (20%)", etc.
(And don't forget a title!)
You can use pie charts to show the relative sizes of many things, such as:
- what type of car people have,
- how many customers a shop has on different days and so on.
- how popular are different breeds of dogs
Your turn: Student Grades
Here is how many students got each grade in the recent test:| A | B | C | D |
| 4 | 12 | 10 | 2 |


Introduction to Linear Functions - grade 3

http://www.mathmammoth.com/preview/Cell_Phone_Plan_Linear_Equations.pdf

El peligro de las redes sociales
Los riesgos de Internet y de las redes sociales para los niños
¿Cuáles son los consejos fundamentales que deben seguir los niños en las redes sociales?
Algunas de las pautas a seguir por el código son:
- Cuando me haga un perfil social, configuraré adecuadamemnte la privacidad para que el contenido que publique sólo pueda ser visto por mis amigos.
- Tendré en cuenta que las personas que conozco por internet son desconocidos en la vida real, NO SON MIS AMIGOS.
- No publicaré información personal como mi teléfono, dirección etc, en Internet
- Cuando se publica una foto en Internet, se pierde el control sobre su difusión y duración. Aunque después se borre, no desaparece de la Red.
- En Internet hay que comportarse con respeto y educación. No hagas a otros lo que no quieras que te hagan a tí.
- Denuncia a las personas o las acciones que perjudiquen a los demás. Si concoes alguien que esté siento acosado, DENÚNCIALO.
- Si adquieres un teléfono movil con internet, desconecta la opción de geolocalización, asi cuando publiques en tu muro desde el movil, nadie sabrá dónde estás.
- Guardaré las conversaciones del chat, ya que te puede ser útil en caso que haya algún problema.
- Si me ocurre algo que no me haga sentir bien en Internet, se lo cumunicaré a mis padres. Tengo que saber decir NO a las cosas que no quiera hacer y contar con mis padres que son mis mejores aliados.
- El mejor filtro para Internet es el conocimiento.
¿Cuáles son los riesgos para los niños en Internet y en las redes sociales?
De esas nuevas formas de comunicarse han surgido nuevos riesgos o formas de acoso con un impacto fatal como el grooming, una práctica a través de la cual un adulto se gana la confianza de un menor con un propósito sexual. El sexting o intercambio de fotografías o vídeos con contenido erótico entre los propios jóvenes con las que luego llegan a extorsionarse causando daños psicológicos importantes. Por otra parte, existe el conocido como ciberbullying, o acoso entre menores que en Internet por su carácter global, supone un alcance que puede llegar a generar mucho daños no sólo al menos sino a su familia y amigos.
De esas nuevas formas de comunicarse han surgido nuevos riesgos o formas de acoso con un impacto fatal como el grooming, una práctica a través de la cual un adulto se gana la confianza de un menor con un propósito sexual. El sexting o intercambio de fotografías o vídeos con contenido erótico entre los propios jóvenes con las que luego llegan a extorsionarse causando daños psicológicos importantes. Por otra parte, existe el conocido como ciberbullying, o acoso entre menores que en Internet por su carácter global, supone un alcance que puede llegar a generar mucho daños no sólo al menos sino a su familia y amigos.
¿A partir de qué edad entran los niños en las redes sociales?
En España, la edad mínima para acceder a una red social, excepto a las específicas para menores, es de 14 años. Actualmente, Tuenti está trabajando con los menores 14 que quieren acceder a la red social a través del consentimiento paterno. Por ello, la Red Social solicita el permiso paterno antes de permitir que se lleve a cabo el registro del perfil.
En España, la edad mínima para acceder a una red social, excepto a las específicas para menores, es de 14 años. Actualmente, Tuenti está trabajando con los menores 14 que quieren acceder a la red social a través del consentimiento paterno. Por ello, la Red Social solicita el permiso paterno antes de permitir que se lleve a cabo el registro del perfil.
¿A qué edad los niños disponen ya de su propio teléfono móvil?
El desarrollo de la telefonía móvil y de los conocidos como Smartphones permite que los jóvenes puedan tener acceso a Internet en su bolsillo. Según el Estudio sobre seguridad y privacidad en el uso de los servicios móviles por los menores españoles, elaborado en 2010 por INTECO y Orange, la edad media de inicio en la telefonía móvil por parte de los menores españoles se sitúa entre los 10 y los 12 años. Además, la mayoría de los menores accede a internet en su casa o en la calle.
El desarrollo de la telefonía móvil y de los conocidos como Smartphones permite que los jóvenes puedan tener acceso a Internet en su bolsillo. Según el Estudio sobre seguridad y privacidad en el uso de los servicios móviles por los menores españoles, elaborado en 2010 por INTECO y Orange, la edad media de inicio en la telefonía móvil por parte de los menores españoles se sitúa entre los 10 y los 12 años. Además, la mayoría de los menores accede a internet en su casa o en la calle.
¿Cómo advertirles de los peligros de esta nueva forma de comunicación?Los
pequeños tienen que valorar la comunicación física por encima de la que
pueden entablar a través de las nuevas tecnologías. Las ventajas de
conocer al interlocutor frente a los riesgos de no hacerlo. Su educación es la base de un futuro Internet más seguro. Así, es importante decirles que tienen que tener en cuenta que hablar habitualmente con un desconocido en internet, no le convierte en conocido. La
adicción a las nuevas tecnologías es un problema en alza que los padres
no deben descuidar y darle la importancia que tiene. El tiempo que
pasen sus hijos en Internet tiene que estar limitado, según sean las
motivaciones de uso de la red y la edad.

Subscribe to:
Posts (Atom)