Funciones afines y lineales

Funciones Lineales

Objetivos de Aprendizaje
·        Definir las funciones lineales y describir sus características.
·        Comparar funciones lineales proporcionales y no proporcionales (afín).
·        Explicar los componentes de la ecuación de una función lineal.

Introducción

Cada mañana Miguel se prepara una taza de café poniendo 2.5 cucharadas de granos de café molidos en su cafetera. A veces, cuando se ha desvelado la noche anterior, necesita 2 tazas de café para despertar, por lo que pone doble cantidad en la cafetera. Si tiene invitados a cenar y quiere servir café con el postre, prepara una cantidad mayor de café. Su receta es simple — pone 2.5 cucharadas por cada taza que quiere preparar.

Miguel puede fácilmente adaptar su receta, porque hay una relación entre la cantidad de granos de café y el número de tazas — al aumentar la cantidad de café, aumenta también la cantidad de granos necesarios. Veamos cómo se ve ésta relación en una gráfica.


Podemos ver que ésta relación es una función— para cada valor independiente (tazas de café), hay un único valor dependiente (cucharadas de granos necesarias). También podemos ver que la gráfica de pares deentradas y salidas es una línea recta. Esto la hace una función lineal — una función es lineal si su gráfica forma una línea recta. La línea es recta porque las variables cambian con una tasa constante. Ésa es otra característica de las funciones lineales — tienen una tasa de cambio constante.

Comparación de Funciones Lineales y Proporcionales

Veamos otro tipo de funciones lineales para entender mejor cómo funcionan.

Mientras que Miguel se toma su café, decide comparar algunos planes de servicios móviles para ver cuál le parece mejor. Su compañía celular le ofrece dos planes. El plan básico cobra 7 centavos por mensaje de texto mandado o recibido. El plan avanzado le permite a Miguel mandar textos, fotos y video, y sólo cobra 2 centimos por mensaje. ¡Perfecto! Pero espera — el plan avanzado tienen un cargo mensual fijo de 10€. Entonces ¿Cómo va a decidir Miguel cuál plan le conviene más?

¡Lo sé! Ambos planes son funciones — el costoe de mandar textos depende del número de textos enviados. Si representamos cada uno, podemos comparar cómo varían los costes.

Empecemos con el plan básico. Podemos calcular el coste (y) de mandar y recibir cualquier número de mensajes (x) con la ecuación simple y = 0.07x (Usando 0.07 en lugar de 7, el coste (y) será medido en euros en lugar de centimos.) Con ésta ecuación podemos calcular los siguientes puntos:

# de Textos
Coste
0
0.00
10
0.70
100
7.00
200
14.00

La gráfica de esos puntos se ve así — una línea recta desde (0,0).


Ahora veremos el plan avanzado. Para calcular el coste (y) de mandar y recibir número de mensajes por mes con éste plan, podemos empezar con una ecuación muy parecida a la que usamos antes: y = 0.02x, porque cada mensaje cuesta 2 centimos. Pero ¿recuerdas el cargo mensual? Tenemos que sumar 10€, y nuestra ecuaciónse vuelve y = 0.02x + 10. Con ésta ecuación, podemos calcular los siguientes valores para el plan avanzado:

# de Textos
Costo
0
10.00
10
10.20
100
12.00
200
14.00

Representando esos puntos.


Ahora la diferencia entre los dos planes es clara — si Miguel manda menos de 200 textos al mes, el plan básico es más barato. Si manda más de 200 textos, habrá ahorrado dinero usando el plan avanzado. Saber esto es útil para Miguel, pero nosotros estamos más interesados en las funciones. Ambas son líneas rectas con una tasa de cambio estable, por lo que son funciones lineales. Pero el plan básico incluye el origen, mientras que el plan avanzado no.

Hay algo especial con las funciones lineales que incluyen el origen — hay una relación multiplicativa simple entre las variables independientes y las variables dependientes. Esto significa que las variables tienen una relación proporcional, y éstas son funciones proporcionales. Para las funciones proporcionales, si multiplicamos ambas variables por el mismo número, su relación se mantendrá. Por ejemplo, volviendo a la tabla del plan básico:

# de Textos
Costo
0
0.00
1
0.07
10
0.70
100
7.00
200
14.00

El coste de un texto = 0.07. Si Miguel quiere encontrar el coste de mandar 10 textos bajo este plan, él podría tomar la ecuación 1 = 0.07 y multiplicar ambos lados por 10. Encontraría un coste de 0.70 por 10 textos. Si multiplicamos ambas cantidades por 0 veríamos que la gráfica debe pasar por el origen. Esto tiene sentido, porque 0 mensajes cuestan 0€.

Ahora veamos la otra función, para el plan avanzado:

# de Textos
Costo
0
10.00
1
10.02
10
10.20
100
12.00
200
14.00

El costo de un texto = 10.02€. ¿Podemos calcular el coste de 10 textos multiplicando ambos lados de la relación por 10? No — ¡10 textos no cuestan 100.20€! ¿Qué salió mal? A pesar de que el plan avanzado es una función lineal, no es una función proporcional — las variables dependiente e independiente no están relacionadas por sólo una constante y no tienen una relación proporcional. Con relaciones no proporcionales, multiplicar la entrada y la salida por el mismo número no funciona. Por esto, funciones lineales no proporcionales no incluyen el origen — el multiplicar la entrada por 0 no hará la salida 0

PROYECTO DE TRIGONOMETRÍA - 4ºESO


PARTE I


Midiendo con Thales de Mileto


Componentes del grupo:

______________________________________________________________________________

______________________________________________________________________________

______________________________________________________________________________


  1. Elegid un elemento del patio que queráis medir (poste, árbol, canasta...), escribe su nombre y dónde está situado.
  1. Mide la distancia de la sombra que proyecta el objeto.
  1. Mide la distancia que proyecta tu sombra.
  1. Mide tu altura.
  2. Haced un boceto como el siguiente, pero con vuestros datos:
  1. Con estas medidas, ¿cuánto mide tu objeto?
  2. Comprueba si tu resultado es correcto.

PARTE II
CONSTRUCCUIÓN Y UTILIZACIÓN DEL CUADRANTE ASTRONÓMICO


Tras realizar el trabajo Midiendo con Tales, es el momento de realizar un nuevo proyecto en el que no necesitarás la luz del sol ni la sombra del objeto. En este proyecto deberás realizar un TUTORIAL, que posteriormente subirás a YouTube, sobre cómo construir un cuadrante y utilizarlo para medir.

Además, en el video deberá aparecer un ejemplo de medición con el cuadrante. Para ello, podéis a medir el mismo objeto que ya medisteis utilizando el Teorema de Tales y comprobareis los resultados, o buscar otro que os parezca más interesante.


Vuestro proyecto consta de las siguientes fases.

1.      CONSTRUCCIÓN DEL CUADRANTE

2.      GRAGABACIÓN DEL VIDEO EN EL QUE SE CONSTRUYE Y SE PONE EN  PRÁCTICA EL USO DEL CUADRANTE

3.      EDICIÓN DEL VIDEO FINAL Y SUBIDA DEL MISMO A LA PLATAFORMA YOUTUBE.


Para la elaboración del cuadrante necesitareis:

·         Cartón grueso o papel

·         Transportador de ángulos (o plantilla del mismo)

·         Trozo de cuerda o hilo de coser.

·         Un peso o plomada (también podéis utilizar un botón)

·         Tubo de bolígrafo o caña de refrescos

Para la construcción de vuestro cuadrante podéis consultar entre otras webs las que se indican a continuación.


Tutorial utilización cuadrante astronómico para medir alturas

GRUPO
Introducción
El grupo se presenta dando los buenos días e introduciendo a sus componentes.
En la presentación, explican la temática del trabajo, qué elemento han elegido para medir y por qué.
El vídeo.

Presentación


Participación de todos los miembros del grupo


Cierre
Calidad del video:

Calidad del Sonido y la imagen


Originalidad
Aspectos lingüísticos.

Pronunciación

Claridad de las explicaciones


Cierre:
El grupo se despide y explica las dificultades o las facilidades que ha encontrado en la realización y si todos los miembros del grupo han trabajado por igual.
Nota final
GRUPO 1


GRUPO 2


GRUPO 3


GRUPO 4


GRUPO 5


GRUPO 6


GRUPO 7


GRUPO 8


Recuperación Final 3ºESO


PARTE 1
1. Operar con fracciones y números decimales.
2. Conocer las propiedades de las potencias y aplicarlas para simplificar operaciones. Resolver problemas.
3. Transformar números decimales en fracciones y viceversa.
4. Operar con polinomios
5. Conocer las propiedades de las progresiones aritméticas y geométricas

PARTE 2
6. Resolver ecuaciones de primer y segundo grado. Resolver sistemas de ecuaciones lineales.
7. Plantear y resolver problemas con ecuaciones.
8. Conocer las relaciones métricas de las cónicas.
9. Aplicar los teoremas de Tales y Pitágoras para encontrar medidas que se desconocen en cálculos de volúmenes.
PARTE 3
10. Conocer las característitcas de una función.
11. Interpretar gráficas de funciones.
12. Calcular la ecuación de la recta y representarla.
13. Elaborar tablas y gráficos estadísticos.
14. Encontrar los parámetros de centralización y dispersión de una distribución estadística.
15. Calcular probabilidades aplicando la regla de Laplace.

Statistics 1ºeso


Simple and Compound Probability


Probability

How likely something is to happen.
Many events can't be predicted with total certainty. The best we can say is how likely they are to happen, using the idea of probability.

Tossing a Coin 

When a coin is tossed, there are two possible outcomes:
  • heads (H) or
  • tails (T)
We say that the probability of the coin landing H is ½.
And the probability of the coin landing T is ½.
pair of dice

Throwing Dice 

When a single die is thrown, there are six possible outcomes: 1, 2, 3, 4, 5, 6.
The probability of any one of them is 1/6.

Probability 

In general:
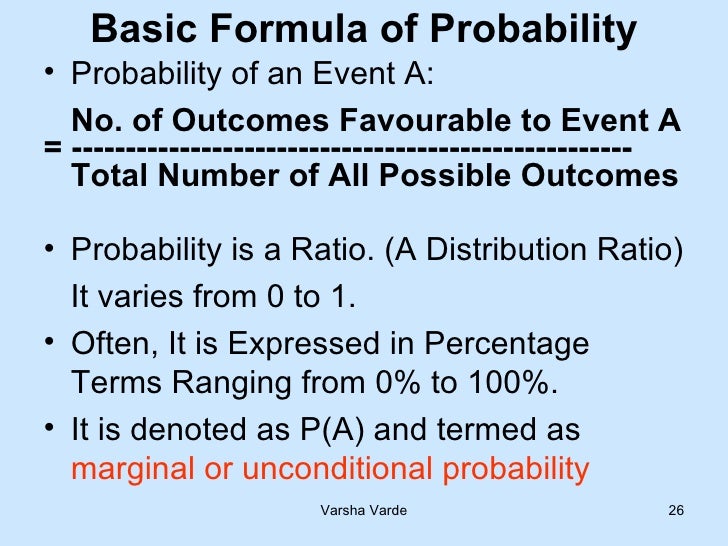
Probability of an event happening = Number of ways it can happen Total number of outcomes

Example: the chances of rolling a "4" with a die

Number of ways it can happen: 1 (there is only 1 face with a "4" on it)
Total number of outcomes: 6 (there are 6 faces altogether)
So the probability = 1 6

Example: there are 5 marbles in a bag: 4 are blue, and 1 is red. What is the probability that a blue marble gets picked?

Number of ways it can happen: 4 (there are 4 blues)
Total number of outcomes: 5 (there are 5 marbles in total)
So the probability = 4 5 = 0,8

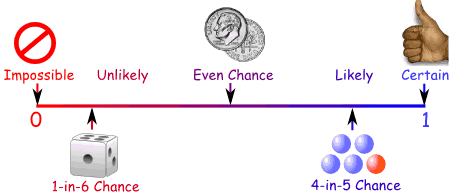
Probability Line

We can show probability on a Probability Line:
Probability is always between 0 and 1

Probability is Just a Guide

Probability does not tell us exactly what will happen, it is just a guide

Example: toss a coin 100 times, how many Heads will come up?

Probability says that heads have a ½ chance, so we can expect 50 Heads.
But when we actually try it we might get 48 heads, or 55 heads ... or anything really, but in most cases it will be a number near 50.
Learn more at Probability Index.

Words

Some words have special meaning in Probability:
Experiment or Trial: an action where the result is uncertain.
Tossing a coin, throwing dice, seeing what pizza people choose are all examples of experiments.
Sample Space: all the possible outcomes of an experiment

Example: choosing a card from a deck

There are 52 cards in a deck (not including Jokers)
So the Sample Space is all 52 possible cards: {Ace of Hearts, 2 of Hearts, etc... }
The Sample Space is made up of Sample Points:
Sample Point: just one of the possible outcomes

Example: Deck of Cards

  • the 5 of Clubs is a sample point
  • the King of Hearts is a sample point
"King" is not a sample point. As there are 4 Kings that is 4 different sample points.

Event: a single result of an experiment

Example Events:

  • Getting a Tail when tossing a coin is an event
  • Rolling a "5" is an event.
An event can include one or more possible outcomes:
  • Choosing a "King" from a deck of cards (any of the 4 Kings) is an event
  • Rolling an "even number" (2, 4 or 6) is also an event

The Sample Space is all possible outcomes.
A Sample Point is just one possible outcome.
And an Event can be one or more of the possible outcomes.

Hey, let's use those words, so you get used to them:
pair of dice

Example: Alex wants to see how many times a "double" comes up when throwing 2 dice.

Each time Alex throws the 2 dice is an Experiment.
It is an Experiment because the result is uncertain.

The Event Alex is looking for is a "double", where both dice have the same number. It is made up of these 6 Sample Points:
{1,1} {2,2} {3,3} {4,4} {5,5} and {6,6}

The Sample Space is all possible outcomes (36 Sample Points):
{1,1} {1,2} {1,3} {1,4} ... {6,3} {6,4} {6,5} {6,6}

These are Alex's Results:
Experiment Is it a Double?
{3,4} No
{5,1} No
{2,2} Yes
{6,3} No
... ...

After 100 Experiments, Alex has 19 "double" Events ... is that close to what you would expect?

Activity: An Experiment with Dice

Let's throw two dice and add the scores ...
You will need:

Interesting point

Many people think that one of these cubes is called "a dice". But no!
The plural is dice, but the singular is die: i.e. 1 die, 2 dice.
The common die has six faces:
We usually call the faces 1, 2, 3, 4, 5 and 6.

Throwing Two Dice and Adding the Scores ...

Example: when one die shows 2 and the other shows 6 the total score is 2 + 6 = 8
Question: Can you get a total of 8 any other way?
What about 6 + 2 = 8 (the other way around), is that a different way?
Yes! Because the two dice are different.
Example: imagine one die is colored red and the other is colored blue.
There are two possibilities:
So 2 + 6 and 6 + 2 are different.
And you can get 8 with other numbers, such as 3 + 5 = 8 and 4 + 4 = 8

High, Low, and Most Likely

Before we start, let's think about what might happen.
Question: If you throw 2 dice together and add the two scores:
  • 1. What is the least possible total score?
  • 2. What is the greatest possible total score?
  • 3. What do you think is the most likely total score?
The first two questions are quite easy to answer:
  • 1. The least possible total score must be 1 + 1 = 2
  • 2. The greatest possible total score must be 6 + 6 = 12
  • 3. The most likely total score is ... ???
Are they all just as likely? Or will some happen more often?
To help answer the third question let us try an experiment.

The Experiment

Throw two dice together 108 times,
add the scores together each time,
record the scores in a tally table.
Why 108? That seems a strange number to choose. I will explain later.
You can record the results in this table using tally marks:
Added
Scores
Tally Frequency
2
3
4
5
6
7
8
9
10
11
12
Total Frequency = 108
OK, Go!
...
...
Finished ...?
Now draw a bar graph to show your results.
Or you can use Data Graphs (Bar, Line and Pie) then print it out.

You may get something like this:
  • Are the bars all about the same height?
  • If not ... why not?

So Why Did We Get That Shape?

The explanation is simple:

  • There is only one way to get a total of 2 (1 + 1),
  • but there are six ways of getting a total of 7 (1 + 6, 2 + 5, 3 + 4, 4 + 3, 5 + 2 and 6 + 1)
Here is a table of all possibile outcomes, and the totals. I have also shown what adds to 7 in bold.
Score on One Die
1 2 3 4 5 6
Score
on the
Other
Die
1 2 3 4 5 6 7
2 3 4 5 6 7 8
3 4 5 6 7 8 9
4 5 6 7 8 9 10
5 6 7 8 9 10 11
6 7 8 9 10 11 12
You can see there is only 1 way to get 2, there are 2 ways to get 3, and so on.
Let us count the ways of getting each total and put them in a table:
Total
Score
Number of
Ways to Get
Score
2 1
3 2
4 3
5 4
6 5
7 6
8 5
9 4
10 3
11 2
12 1
Total = 36
Can you see the Symmetry in this table?
  • 2 and 12 have the same number of ways = 1 each
  • 3 and 11 have the same number of ways = 2 each
  • 4 and 10 have the same number of ways = 3 each
  • 5 and 9 have the same number of ways = 4 each
  • 6 and 8 have the same number of ways = 5 each

108 Throws

OK, why 108 throws? Well, only 36 throws might not give good results, 360 throws would be great, but take a long time, so 108 (which is 3 lots of 36) seems just right.
So let's multiply all these numbers by 3 to match our total of 108:
Total
Score
Number of
Ways to Get
Score
2 3
3 6
4 9
5 12
6 15
7 18
8 15
9 12
10 9
11 6
12 3
Total = 108
Those are the theoretical values, as opposed to the experimental ones you got from your experiment.
The theoretical values look like this in a bar graph:
How do these theoretical results compare with your experimental results?
This graph and your graph should be quite similar, but they are not likely to be exactly the same, as your experiment relied on chance, and the number of times you did it was fairly small.
If you did the experiment a very large number of times, you should get results much closer to the theoretical ones.
And, by the way, we've now answered the question from near the beginning of the experiment:
What is the most likely total score?
  • 7 has the highest bar, so 7 is the most likely total score.
Hey, is that why people talk about Lucky 7 ... ?

Probability

On the page Probability you will find a formula:
Probability of an event happening = Number of ways it can happen Total number of outcomes

Example: Probability of a total of 2

We know there are 36 possible outcomes.
And there is only 1 way to get a total score of 2.
So the probability of getting 2 is:
Probability of a 2 = 1 36
Doing that for each score gets us:
Total
Score
Probability
2 1/36
3 2/36
4 3/36
5 4/36
6 5/36
7 6/36
8 5/36
9 4/36
10 3/36
11 2/36
12 1/36
Total = 1
(Note: I didn't simplify the fractions)
The sum of all the probabilities is 1

PRACTICE